Reader's Forum
1. THE WORLD´S HYDRO GENERATOR MANUFACTURERS
According to “2025 World Hydropower Outlook" of IHA (International Hydropower Association), the world's total installed hydro capacity by December 31, 2024, amounted to 1,253,870 MW (please note that this figure of the 2025 edition of IHA doesn't include pumped-storage capacity). Converted into electrical hydro generator output, this is equivalent to about 1,400,000 MVA. It would be interesting to know, how many hydro units are presently installed worldwide. It is also of interest, when these units were built, by whom and what the main technical data are.
According to the "2025 World Hydropower Outlook", the pumped-storage capacity at year end 2024 was 189,412 MW.
There are some data bases published already, but, without exception, they give very limited information. Apart from the utility, plant name and other general information, the only technical data available is the unit MVA output. It is therefore desirable, to compile a comprehensive hydro generator record containing the following data:
- Company name
- Plant name
- Year ordered (or manufactured or installed)
- No. of units
- Max. continuous unit output in kVA
- Rated voltage
- Rated speed
- Frequency
- Design (IM designation)
- Miscellaneous information
In order to limit the amount of work, only hydro generators with a unit output of 5 MVA and above should be considered. It is estimated, that the total installed hydro capacity of units below 5 MVA output is less than 3 percent of the total.
The most accurate way to put together a hydro generator data base is to rely on the information given by the user/operator or by the original equipment manufacturers (OEMs). All major OEMs have published so-called reference lists, which contain most, if not all, the above listed technical data. These reference lists serve not only as public relations instruments of OEMs, but are also an essential part of documentation submitted to utilities during the bidding process for new hydro projects.
Before approaching the respective OEMs for assistance in the described task, one has to determine which equipment manufacturers qualify for having delivered hydro generators of at least 5 MVA unit output. It is to be remembered that the first commercially utilized hydro generators were built and commissioned about 1880. The earliest hydro generators were using direct current (d.c.) technology. Because of its inherent transmission limitations, d.c. machinery was replaced by alternating current generators and a.c. transmission systems took on a state-of-the-art lead role. In 1891, Oerlikon built and installed a 300 h.p. three-phase hydro generator for the LAUFFEN power plant in Germany. The generator voltage of 55 Volts was transformed to 15,000 Volts (later 25,000 Volts) and was transmitted over a 175 km long overhead transmission line to Frankfurt/Main. The system was officially inaugurated August 24, 1891. This date can be regarded as the starting point of a.c. three-phase power generation and transmission.
A 5 MVA hydro generator output may have been reached and exceeded about 1900.
According to an investigation currently in progress, there are about 130 OEMs that could qualify for the worldwide hydro generator data bank. Some of these companies have disappeared or have been absorbed by competitors. Also, as a result some new company names appeared. A preliminary list of hydro generator manufacturers can be viewed by clicking HERE.
The author would appreciate corrections or additions under info@hydropower-consult.com to the above mentioned OEM list.
STATUS: August 31, 2025
2. THE SANXIA (THREE GORGES) EXPERIENCE
The SANXIA hydro power plant is located in Central China on the Yangtze River, about 1,050 km upstream of the city of Shanghai. After preliminary completion in 2008, SANXIA was the world´s largest power plant, with a complement of 26 hydro generators rated at 700 MW each. The total project cost originally was estimated at 25 Billion US Dollars. With 6 additional generators installed in an underground powerhouse, the total project cost will increase considerably. After plant completion in May 2012, the annual electricity generation usually is well in excess of 90 Billion kilowatt-hours (kWh), depending on precipitation conditions (see 7. PLANT FACTORS).
In 1997, an order for 6 Francis turbines and hydro generators was placed with the VGS consortium, then consisting of VOITH, GE HYDRO (Canada) and SIEMENS. After the amalgamation of the hydro activities of VOITH and SIEMENS in April 2000, VOITH SIEMENS HYDRO and GE HYDRO (Canada) became successor partners of the VGS consortium.
In April 2003, VOITH SIEMENS HYDRO entrusted HYDROPOWER CONSULT with the commissioning of the first two pure water-cooling systems and their associated direct water-cooled stator windings. The Chinese designation of the two generators in question is Unit 02 and Unit 03. Commissioning was performed in May and June 2003. The third pure water-cooling system and stator winding (Unit 01) was commissioned by HYDROPOWER CONSULT in October 2003, whereas the fourth and fifth pure water-cooling system and stator winding (Unit 07 and Unit 08) were commissioned April 2004 and July 2004, respectively. HYDROPOWER CONSULT commissioned the sixth and final VGS pure water-cooling system and stator winding (Unit 09) in August 2005.
Major commissioning activities were as follows:
- Hydrostatic pressure testing of the pure water cooling system and stator winding.
- Commissioning of ion exchanger and alkalizer unit, including pH regulation.
- Determination of flow characteristics of pure water pumps and stator winding.
- Ultrasonic flow measurements on each individual stator winding cooling circuit. The results of these activities were later confirmed by temperature measurements, performed at rated current in short-circuit mode.
- Commissioning of pure water system control, including pure water temperature regulation.
Originally there were two cooling options for the SANXIA hydro generator stator windings: Conventional air-cooling or direct water-cooling. The Chinese authorities selected a water-cooled design for all 14 units of the first project stage (left bank power house), which has the advantage of an increased stator winding insulation life and a substantial overload potential. The majority of hydro generators in China are air-cooled. According to the statement made by a Chinese specialist in a publication, other water-cooled hydro generators installed in China “have not been very successful” (1.). One can only speculate about the source of problems. The most likely cause is clogging of hollow copper conductors by copper oxide sediments. To avoid such problems, Siemens introduced a very effective solution in 1978, by increasing the pH value of the demineralized cooling water (2.). This method has also been applied to the SANXIA generators built by the VGS consortium. The expertise thus gained will now enable the Chinese operators to solve their water cooling problems, regardless whether hydro generators or thermal turbine-generators are involved.
The second project stage (right hand power house) consisted of 12 more units, of which the stator windings of 8 generators are direct water-cooled and 4 generators are air-cooled.
The working language at the SANXIA site between Chinese personnel and foreign experts was English. As the number of qualified interpreters was very limited, working conditions for the foreign experts were occasionally hampered. The foreign experts were often trying to locate a competent interpreter and at the same time find workers to whom tasks could be delegated. It is remarkable in this context that there was not a single person at site with English as his native language as the entire GE HYDRO (Canada) workforce came from the province of Quebec and was of French descent, while the VOITH SIEMENS HYDRO staff were Germans and Brazilians.
The principal generator data are as follows:
- Output 840 MVA
- Voltage 20 kV
- Rated speed 75 rpm
- Frequency 50 Hz
Impounding of the upper reservoir commenced on June 01, 2003, and the first operational upstream water level of 135 m was reached on June 10. For improving navigation conditions and in order to increase electricity generation during the Yangtze River's dry season (from about October to May), the water level was later increased by another 4 m. The new level was achieved on November 05, 2003. The second round of water impounding commenced on September 20, 2006, and was completed on October 28, 2006, when an upstream water level of 155.74 m was reached. The final head increase was carried out between September 28 and November 11, 2008. The maximum water level of 172.79 m achieved was slightly below of the design head of 175 m above sea level.
The first VGS unit, installed in #2 pit of the powerhouse, and therefore designated Unit 02, was the first SANXIA unit to be run up and reached rated speed on June 12, 2003. After successfully passing all scheduled commissioning tests, the generator was first synchronized with the Chinese grid on June 24, more than 6 weeks ahead of schedule. A maximum turbine output of 550 MW (at 135 m) was obtained June 26, 2003. Overspeed and load rejection tests were completed without problems.
Generator commissioning continued with a contractually-stipulated 72-hour trial run. Commercial operation of the VGS generator commenced on August 10, 2003, after successfully passing an additional 30-day operational trial run. The water level of the upper reservoir then present was 139 m above sea level. Generator output was therefore limited to about 600 MW.
Considering the magnitude of the project and the number of parties involved, one has to say that the actual commissioning was achieved in a remarkably short time. Counting the time span between first run-up and start of the 72-hour full-load run, commissioning of the first unit (Unit 02) was completed in only 19 days. This can largely be attributed to the high quality of the turbine and generator design and construction, as well as the high professionalism of the manufacturer's personnel supervising the erection and commissioning activities.
The second VGS unit (Unit 03) also finished the 72-hour full-load run and the 30-day operational test run to the highest satisfaction of the China Yangtze Three Gorges Project Development Corporation.
The third VGS unit (Unit 01) was commissioned in November 2003. A new record was set, when commercial full-load operation commenced a mere seven days after first roll. More astonishing even is the fact that altogether six of the world´s largest generating units were placed into commercial operation within a six-month time period.
By September 2005, all of the 14 generating units in the left bank powerhouse had been put in operation.
The first of the 12 generating units in the right bank powerhouse was commissioned in June 2007. On October 30, 2008, the final unit went into operation, thus completing the original project.
In 2002 plans were issued to add 6 more generators to the project. These units are installed in an underground powerhouse. The stator windings of 2 generators are direct water-cooled and 2 other ones are air-cooled. For the stator windings of the 2 remaining generators, the Chinese manufacturer implemented a so-called "evaporative" cooling technology. The type of refrigerant is unknown. It is also unknown whether this type of cooling is operating satisfactorily. However, all hydro generators in the plus 700 MW class ordered since SANXIA - either in operation or still in the construction phase - have been equipped with conventional air-cooling. The final unit completed its acceptance tests at the end of May 2012.
Important lessons can be learned by the hydro industry and it would be worthwhile to analyze the background of this achievement and how the SANXIA project is being managed.
VOITH SIEMENS HYDRO has published additional information on the SANXIA project in a special issue of their customer's magazine August 2003 (3.).
References:
(1.) Huang Yuanfang:
Technical challenges for the design of the Three
Gorges generating equipment.
Hydropower & Dams Issue Two, 1996, pages 32
- 36.
(2.) K. Schleithoff, H.-W. Emshoff:
Optimization of the Conditioning of
Generator Cooling Water.
VGB Kraftwerkstechnik 70, 9, 1990, pages 677 -
681.
(3.) Voith Siemens Hydro:
HyPower Special Issue Three Gorges,
China.
August 2003.
The construction of the Three Gorges Dam and Generating Station has been a controversial project both in China and abroad. One must conclude, that the Chinese Government felt that it would be to China's advantage to proceed with this dam and generation development, as energy was badly needed. Of course, the project imposed hardships on the population in or near the development sites, as well as downstream. Additionally, due to unpredictable factors, the development poses certain future threats. The Chinese Government obviously is convinced that the benefits outweigh the risks. Alas, the official Government views could not be found on the internet.
Interesting and detailed project information can be found on the internet under https://en.wikipedia.org/wiki/Three_Gorges_Dam
The author would appreciate comments under info@hydropower-consult.com
STATUS: June 30, 2021
3. LARGE HYDRO GENERATORS MEAN LARGE NUMBERS
The hydro generator business is dealing with a product of enormous dimensions and challenges.
Worldwide, there are at present quite a few 600 to 1,000 MW hydro generators in operation or construction. These units are designated for the following hydroelectric power plants:
| GRAND COULEE (USA) | 3 units of 805 MW each |
| GURI (Venezuela) | 10 units of 730 MW each |
| ITAIPU (Brazil/Paraguay) | 20 units of 700 MW each |
| SANXIA (China) | 32 units of 700 MW each |
| SAYANO SHUSHENSKAYA (Russia) | 10 units of 720 MW each |
| XIANGJIABA (China) | 8 units of 800 MW each |
| XIAOWAN (China) | 6 units of 700 MW each |
| XILUODU (China) | 18 units of 770 MW each |
| WUDONGDE (China) | 12 units of 900 MW each |
| BAIHETAN (China) | 16 units of 1,000 MW each |
| BELO MONTE (Brazil) | 18 units of 630 MW each |
To illustrate the dimensions, weights, outputs, centrifugal forces and other characteristics connected with large hydro generators, some examples are given below.
POWER
The following three examples well illustrate how much power or energy is delivered from an 800 MW hydro generator:
- An output of 800 MW is equivalent to 8,000 x 100 kW. A motor-car equipped with an engine of 100 kW (equivalent to about 135 horse-power) can travel at a maximum speed of about 200 kilometres per hour (125 miles per hour). If these 8,000 motor-cars are lined up side by side and assuming that each vehicle requires a space of two metres, then one can imagine a line-up of a total of 8,000 motor-cars, 16 kilometres wide (10 miles), travelling at a speed of 200 kilometres per hour.
- An Olympic swimming pool is 50 metres long, 25 metres wide and 2 metres deep. The volume of water is 2,500 cubic metres, weighing 2,500 tons. The 800 MW output of the generator can heat up this water volume from 20 °C to boiling temperature in less than 18 minutes.
- If 800 MW were applied to an electric steel-melting furnace for one hour, this energy would melt 4,000 tons of steel. This is approximately the weight of the 800 MW hydro generator itself.
CENTRIFUGAL FORCES
Radial acceleration forces are acting on all rotor parts, resulting in impressive centrifugal forces, as the following example illustrates:
- The field poles and coils of the WEHR generator-motors (originally built by Siemens) each weigh 10.6 metric tons. At 600 rpm, which is the rated speed, the centrifugal force is about 680 times its own weight, resulting in a centrifugal force of 7,200 tons trying to pull each of the 10 poles away from the rotor rim. These 7,200 tons happen to be exactly the weight of the Eiffel Tower steel structure. At runaway speed the centrifugal forces on each field pole amount to a staggering 22,800 tons.
For comparison: The Airbus A380 has an operational net weight of 280 metric tons and a maximum loaded take-off weight of 560 metric tons. The SATURN V moon rocket had a take-off weight of about 3,000 metric tons.
CIRCUMFERENTIAL SPEED
The WEHR unit has a stator bore diameter of 3.85 metres. Based on this dimension, the field pole surface speed at 600 rpm rated speed is about 121 metres per second, which is equivalent to 435 kilometres per hour (270 miles per hour). At runaway speed the pole surfaces would travel at a speed of 216 metres per second, equivalent to 777 kilometres per hour (483 miles per hour).
WEIGHTS
The generator rotor weight of a 50 Hz ITAIPU unit is about 2,000 metric tons.
ROTATIONAL ENERGY
The rotational energy is the kinetic energy due to the rotation of an object. This energy can be calculated by use of the moment of inertia and the angular velocity of this object. The kinetic energy of the 2,000 ton ITAIPU rotor at rated speed amounts to about 1,000 kWh. At first glance this may not be an impressive figure to most of us. We have to bear in mind, however, that one kilowatt-hour is the energy an individual weighting 80 kilograms has to provide when climbing a mountain of 4,600 metres. Back to ITAIPU: An energy of 1,000 kWh can lift the 2,000 ton ITAIPU rotor about 180 metres.
EARNING CAPACITY
At 10 Eurocents per kWh and with a plant factor of 100 percent, the income for an 800 MW unit running at full output is Euro 1.920 Million per day.
STATUS: March 31, 2024
4. TECHNICAL DIFFICULTY FACTOR (TDF)
The higher the output and the higher the rated speed of a hydro generator, the more demanding is the design. For visualization, a “Technical Difficulty Factor” has been defined as follows:
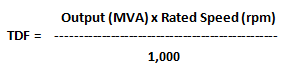
The above formula gives a first indication of how demanding and ambitious the generator design in question will be. For comparison purposes, some actual figures are given below:
| Max. Output | Speed | TDF | |
|---|---|---|---|
| CHANG LONG SHAN (China) | 389 MVA | 600 rpm | 233 |
| GUANGZHOU (China) | 380 MVA | 500 rpm | 190 |
| WEHR (Germany) | 300 MVA | 600 rpm | 180 |
| SILZ (Austria) | 352 MVA | 500 rpm | 176 |
| FRADES II (Portugal) | 433 MVA | 375 rpm | 162 |
| HELMS (USA) | 448 MVA | 360 rpm | 161 |
| BATH COUNTY (USA) | 557 MVA | 257 rpm | 143 |
| RODUND II (Austria) | 345 MVA | 375 rpm | 129 |
| RACCOON MTN. (USA) | 425 MVA | 300 rpm | 128 |
| BAIHETAN. (China) | 1,111 MVA | 111 rpm | 123 |
| XILUODU (China) | 856 MVA | 125 rpm | 107 |
| AKKOY II (Turkey) | 135 MVA | 750 rpm | 101 |
| GURI (Venezuela) | 805 MVA | 112 rpm | 90 |
| WUDONGDE (China) | 945 MVA | 91 rpm | 86 |
| ITAIPU 50 Hz (Paraguay) | 824 MVA | 91 rpm | 75 |
| GRAND COULEE (USA) | 826 MVA | 86 rpm | 71 |
| SANXIA (China) | 840 MVA | 75 rpm | 63 |
Large hydro generators and quite a few synchronous condensers are of salient-pole design. For comparison the TDF figure of a synchronous condenser unit is given below:
| Max. Output | Speed | TDF | |
|---|---|---|---|
| RIEL (Canada) | 250 MVA | 1,200 rpm | 300 |
Technical data courtesy of VOITH HYDRO.
STATUS: March 31, 2024
5. OUTPUT PER POLE
One important design characteristic is the “MVA per pole” figure. The table below shows some values derived from high output generators built by VOITH HYDRO:
| Max. Output | Speed | MVA per Pole | |
|---|---|---|---|
| CHANG LONG SHAN (China) | 389 MVA | 600 rpm | 38.9 |
| GUANGZHOU (China) | 380 MVA | 500 rpm | 31.7 |
| WEHR (Germany) | 300 MVA | 600 rpm | 30.0 |
| FRADES II (Portugal) | 433 MVA | 375 rpm | 27.1 |
| RODUND II (Austria) | 345 MVA | 375 rpm | 21.6 |
| BATH COUNTY (USA) | 557 MVA | 257 rpm | 19.9 |
| XILUODU (China) | 856 MVA | 125 rpm | 17.8 |
| RACCOON MTN. (USA) | 425 MVA | 300 rpm | 17.7 |
| AKKOY II (Turkey) | 135 MVA | 750 rpm | 16.9 |
| WUDONGDE (China) | 945 MVA | 91 rpm | 14.3 |
| GURI (Venezuela) | 805 MVA | 112 rpm | 12.6 |
| ITAIPU 50 Hz (Paraguay) | 824 MVA | 91 rpm | 12.5 |
| SANXIA (China) | 840 MVA | 75 rpm | 10.5 |
| GRAND COULEE (USA) | 826 MVA | 86 rpm | 9.8 |
Large hydro generators and some synchronous condensers are of salient-pole design. For comparison the MVA per pole figure of a synchronous condenser unit is given below:
| Max. Output | Speed | MVA per Pole | |
|---|---|---|---|
| RIEL (Canada) | 250 MVA | 1,200 rpm | 41.7 |
Technical data courtesy of VOITH HYDRO.
As can be seen from the data above, the practical range for high output hydro generators is between 10 MVA per pole (low speed units) and 40 MVA per pole (high speed units).
STATUS: March 31, 2024
6. LOSS EVALUATION
Loss evaluations nowadays form an important part of all bid specifications. Based on the utilities energy price per kilowatt-hour and some other factors, the generator losses of every bid are to be multiplied with the loss evaluation figure and added to the generator bid price. One can, therefore, regard such loss evaluation as a fine: The higher the losses, the higher the penalty. In other words: A high-efficiency generator design can in some cases compensate for a moderately high bid price.
Some recent bid documents in Europe specified loss evaluation values as follows:
- Load-independent losses (friction, windage, stator core): Up to Euro 7,000 per kilowatt
- Load-dependent losses (armature and field winding): Up to Euro 5,000 per kilowatt
In one particular case a loss evaluation of Euro 13,000 per kilowatt was specified. The utility may have arrived at this figure as follows:
| Cost per kilowatt-hour | 10.0 Eurocents |
| Generator service life | 30 years |
| Plant factor | 50 percent |
| Euro 0.10 x 30 years x 24 hours x 365 days x 0.5 = Euro 13,140 | |
For comparison: Taking into account the fixed meter charge, the average residential customer in Germany is presently (2025) being charged between 30 and 40 Eurocents per kilowatt-hour.
To illustrate the importance of loss evaluation, an example of a fictional bid evaluation can be viewed by clicking HERE.
STATUS: August 31, 2025
7. PLANT FACTORS
One of the parameters for a hydro power station that reflects its performance, and key input into the design process, is the plant factor, also known as capacity factor. The plant factor is the ratio of mean annual output (over a number of years of operation) of a power station to its maximum annual output if it operates at full capacity for the whole year.
The following table contains information published on the internet by the U.S. Bureau of Reclamation (https://www.usbr.gov):
GRAND COULEE (Currently installed capacity 6,809 MW)
| Year | Net generation (Billion kWh) | Plant factor (percent*) |
|---|---|---|
| 2000 | 22.849 | 38.3 |
| 2001 | 14.698 | 24.6 |
| 2002 | 20.215 | 33.9 |
| 2003 | 19.171 | 32.1 |
| 2004 | 18.702 | 31.4 |
| 2005 | 20.683 | 34.7 |
| 2006 | 21.968 | 36.8 |
| 2007 | 21.859 | 36.6 |
| 2008 | 21.891 | 36.7 |
| 2009 | 18.633 | 31.2 |
| 2010 | 17.247 | 28.9 |
| 2011 | 24.609 | 41.2 |
| 2012 | 26.468 | 44.3 |
| 2013 | 21.082 | 35.3 |
| 2014 | 20.247 | 33.9 |
| 2015 | 18.927 | 31.7 |
| 2016 | 19.017 | 31.8 |
| 2017 | 20.996 | 35.2 |
| 2018 | 22.031 | 36.9 |
| 2019 | 16.587 | 27.8 |
| 2020 | not available | not available |
| 2021 | not available | not available |
| 2022 | not available | not available |
| 2023 | not available | not available |
| 2024 | not available | not available |
| Average plant factor: | 34.2 | |
* The plant factors in the table above are based on a plant output of 6,809 MW.
In comparison with other run-of-river plants, a plant factor of 34.2 percent seems to be low. It must be noted, however, that the main role of the GRAND COULEE hydroelectric plant is to supply peak power, not base power.
The following table contains information published on the internet by ITAIPU BINACIONAL (https://www.itaipu.gov.br/en):
ITAIPU (Final installed capacity 14,000 MW)
| Year | Net generation (Billion kWh) | Plant factor (percent*) |
|---|---|---|
| 2007 | 90.620 | 82.1 |
| 2008 | 94.685 | 85.6 |
| 2009 | 91.651 | 83.0 |
| 2010 | 87.970 | 79.7 |
| 2011 | 92.246 | 83.6 |
| 2012 | 98.287 | 88.8 |
| 2013 | 98.630 | 89.4 |
| 2014 | 87.800 | 79.5 |
| 2015 | 89.500 | 81.1 |
| 2016 | 103.098 | 93.2 |
| 2017 | 96.387 | 87.3 |
| 2018 | 96.586 | 87.5 |
| 2019 | 79.445 | 72.0 |
| 2020 | 76.382 | 69.0 |
| 2021 | 66.400 | 60.2 |
| 2022 | 69.873 | 63.3 |
| 2023 | 83.879 | 76.0 |
| 2024 | 67.089 | 60.6 |
| Average plant factor: | 79.0 | |
* The plant factors in the table above are based on a plant output of 12,600 MW. Twenty generating units are installed at ITAIPU, but only 18 of them are permitted to run simultaneously. The remaining two units are acting as reserve in case unscheduled outages arise.
The following table contains information published on the internet by CHINA THREE GORGES CORPORATION (http://www.ctgpc.com/english/index.html):
SANXIA (Final installed capacity 22,500 MW)
The anticipated annual electricity production for the SANXIA power plant has been originally estimated to be about 84.700 Billion kilowatt-hours. With 26 generators of 700 MW each, one arrives at a plant factor of about 53 percent.
During the power plant construction phase in 2002, a decision was made to add 6 generators, 700 MW each, to the project. These generators were installed in an underground powerhouse with the intention of using them as peaking units and for generating additional power during the flood season.
The last and final generating unit was integrated into the SANXIA hydropower plant the end of May 2012, thus completing the project. As mentioned before (see 2. THE SANXIA (THREE GORGES) EXPERIENCE) the stator windings of two of these 700 MW generators (units 27 and 28, built by DFEM) incorporated a novel "evaporative" cooling system.
The addition of these six 700 MW generators, together with 2 power plant auxiliary generators of 50 MW each, raised the installed power plant capacity to 22,500 MW.
| Year | Net generation (Billion kWh) | Plant factor (percent*) |
|---|---|---|
| 2012 | 98.100 | 49.6 |
| 2013 | 83.270 | 42.2 |
| 2014 | 98.800 | 50.1 |
| 2015 | 87.000 | 44.1 |
| 2016 | 93.500 | 47.3 |
| 2017 | 97.600 | 49.5 |
| 2018 | 101.600 | 51.5 |
| 2019 | 96.880 | 49.2 |
| 2020 | 111.800 | 56.6 |
| 2021 | 103.649 | 52.6 |
| 2022 | 78.790 | 40.0 |
| 2023 | 80.271 | 40.7 |
| 2024 | 82.911 | 42.0 |
| Average plant factor: | 47.3 | |
* The plant factors above are based on a plant output of 22,500 MW.
As one can assume from the plant figures above, the Parana River, where the ITAIPU power plant is located, most likely has a more uniform water flow all year round than the Yangtze River. During winter time, the water flow of the Yangtze River in the vicinity of SANXIA can drop to 3,500 cubic metres per second and the utility may reduce generation figures down to 3,000 MW for best utilization of inflow and head.
STATUS: August 31, 2025
8. THE WORLD’S LARGEST HYDROPOWER PLANT
There was a controversy on which electric power plant is the largest in the world. The answer is two-fold. The SANXIA hydropower plant is by far the largest power plant in the world based on the installed generation capacity of 22,500 MW. However, when the generated output comes into play, this merit is less easy to allocate. The last generating unit at the ITAIPU power plant has been declared operational in March 2007. From 2007 until 2024 the average annual generation amounted to 87.252 Billion kilowatt-hours and the highest generation achieved was in 2016, when 103.098 Billion kilowatt-hours were generated at ITAIPU.
For SANXIA the average annual generation from 2012 until 2024 was 93.398 Billion kilowatt-hours and the highest generation achieved was in 2020, when 111.800 Billion kilowatt-hours were generated at SANXIA. The average annual generation figures of ITAIPU and SANXIA are comparable, but with a 7.0 percent edge in favour of SANXIA.
STATUS: August 31, 2025
9. THE WORLD’S TOTAL INSTALLED HYDRO CAPACITY
According to the "2025 World Hydropower Outlook" of International Hydropower Association (IHA), the world’s total installed hydro capacity on December 31, 2024, was geographically distributed as follows:
| Region | 2024 Installed Hydro Capacity (without pumped-storage) (MW) |
|---|---|
| North and Central America | 185,032 |
| South America | 181,619 |
| Europe (incl. Turkey) | 206,658 |
| South and Central Asia (incl. Russia) | 158,842 |
| Africa | 43,574 |
| East Asia and Pacific (incl. China) | 466,615 |
| Australia/New Zealand | 11,530 |
| World Total | 1,253,870 |
According to the "2025 World Hydropower Outlook", the world’s hydroelectricity generation for year 2024 (excluding pumped-storage) was geographically distributed as follows:
| Region | 2024 Net Hydroelectric Power Generation (Billion kWh) | Capacity Factor (percent) |
|---|---|---|
| North and Central America | 637.000 | 39.2 |
| South America | 725.000 | 45.4 |
| Europe (incl. Turkey) | 680.000 | 37.5 |
| South and Central Asia (incl. Russia) | 564.000 | 40.4 |
| Africa | 167.000 | 43.6 |
| East Asia and Pacific (incl. China) | 1,764.000 | 43.0 |
| Australia/New Zealand | 40.000 | 39.5 |
| World Total | 4,577.000 | 41.6 |
Some may view the above listed capacity factors of hydroelectric generation to be low. However, one has to bear in mind that most of the reservoir-linked hydro power plants deliver very valuable peak power. One has also bear in mind, that the installed pumped-storage capacity is excluded in the above power generation figures.
According to IHA, the leading countries in hydro generation in 2024 (excluding pumped-storage) were as follows:
| Country | 2024 Net Hydroelectric Power Generation (Billion kWh) |
|---|---|
| China | 1,424.000 |
| Brazil | 415.000 |
| Canada | 342.000 |
| USA | 242.000 |
| Russian Federation | 212.000 |
| India | 198.000 |
| Norway | 140.000 |
| Vietnam | 96.000 |
| Japan | 80.000 |
| France | 75.000 |
| Turkey | 75.000 |
| Venezuela | 73.000 |
| Sweden | 65.000 |
By the end of 2024, China was the world leader in installed hydro capacity, followed by Brazil, Canada and USA. The leading countries are as follows:
| Country | 2024 Installed Hydro Capacity (without pumped-storage) per IHA (MW) |
|---|---|
| China | 377,260 |
| Brazil | 109,962 |
| Canada | 84,123 |
| USA | 79,830 |
| Russia | 52,942 |
| India | 47,323 |
| Turkey | 32,770 |
| Norway | 32,508 |
| Vietnam | 23,058 |
| Japan | 22,190 |
| France (2023 data) | 20,483 |
| Venezuela | 18,366 |
| Spain | 17,097 |
| World Total | 1,253,870 |
It must be pointed out in this context, that the statistical data published by various organizations can differ considerably from each other. Some data include pumped-storage installations, which must not be treated as genuine hydropower generation plants as they only convert energy originally generated by other means. Other statistics differentiate between public utilities, private utilities and industry. To make matters statistically even more complicated: The MALTA hydropower plant in Austria, for instance, has four generating units installed. Two units are coupled to a Pelton wheel of 182,500 kW each, and the other two units are each connected to a 182,500 kW Pelton wheel and to pump impellers of 145,000 kW each. The question arises, whether the pumped-storage power portion of the MALTA power plant amounts to 290 MW pumping or to 365 MW generating. The total generating capacity of the MALTA power plant amounts to 730 MW, of course.
It is a less-known fact that the GRAND COULEE plant has six pumps of 48.47 MW each installed for a total pumping capacity of 291 MW. The generating capacity of these units amount to 314 MW.
For some statistics it is unclear whether they include small hydro or not.
According to REN21, the small hydro definition varies by country as follows:
| Sweden | < 1.5 MW |
| Norway | < 10 MW |
| India | < 25 MW |
| Brazil and U.S. | < 30 MW |
| Canada and China | < 50 MW |
STATUS: August 31, 2025
10. COMPARISON OF HYDRO, PUMPED-STORAGE, NUCLEAR, WIND, SOLAR AND BIOMASS POWER IN GERMANY
HYDRO
According to data supplied by the German Grid Control Agency (Bundesnetz-Agentur), the total generation capacity of all German hydro power plants (including micro power plants, but excluding pumped-storage plants) by May 14, 2025, amounted to 5,651 MW gross. The hydro energy net production reported by the Fraunhofer Institute ISE for 2024 was 22.50 Billion kilowatt-hours, which therefore represents a capacity factor of 45.3 percent.
Statistics regarding German hydropower data have to be looked at with caution. The 5,651 MW figure includes all bi-national installations on the border rivers like the Danube, Inn and Rhine. By international contracts their output and generation is split between the countries concerned, i.e. between Germany and Austria, France and Switzerland. Quite a few other hydropower plants were completely constructed in Austria, but were financed by German utilities. These plants feed into the German grid and are regarded by some authors of statistics as German power plants.
PUMPED-STORAGE
Based on data supplied by the German Grid Control Agency (Bundesnetz-Agentur), the total generation capacity of all German pumped-storage plants by May 14, 2025 amounted to 9,422 MW.
Again, statistics regarding German hydropower data have to be looked at with caution. Some pumped-storage plants have been constructed on Austrian and Luxemburg soil, but were financed by German utilities and are - by contract - feeding their electrical energy into the German grid.
The actual generation capacity of all pumped-storage plants installed and in operation in Germany by May 14, 2025, amounted to 6,297 MW. At first glance this is an impressive figure. But when all German pumped-storage reservoirs of about 38,100 MWh capacity are topped-up, it takes slightly more than 6.0 hours to discharge this amount of energy. Once the reservoirs are exhausted, other replacement sources have to be found.
NUCLEAR
By the end of 2000 the total generation capacity of the 19 nuclear reactors installed in Germany was 22,365 MW, reported by Kerntechnik Deutschland e.V. In 2001, the energy production in these plants amounted to 171.3 Billion kilowatt-hours, representing a capacity factor of 87.4 percent. The tsunami-related Fukushima accident on March 11, 2011, prompted the German Government to shut down 6 reactors and to deactivate two more reactors due to repairs of conventional components (main transformer and switchyard). Re-commissioning was stopped by legal action. Additional reactors were decommissioned the years after. The last 3 reactors, representing an output of 4,056 MW were decommissioned April 15, 2023.
WIND
By the end of 2024 the total generation capacity of all wind power plants installed amounted according to the Fraunhofer Institute ISE to a staggering 72,400 MW, (63,200 MW onshore and 9,200 MW offshore).
According to the Institute ISE, the wind energy production (net) in 2024 amounted to 136.400 Billion kilowatt-hours. In relation to the 72,400 MW figure this represents an average capacity factor of about 21.4 percent.
SOLAR
Based on the Fraunhofer Institute ISE, the total generation capacity of all solar (photovoltaic) power plants installed end of 2024 amounted to 97,600 MW.
The ISE Institute also issued a solar energy production (net) for 2024 of 72.200 Billion kilowatt-hours. In relation to the 97,600 MW figure this represents an average capacity factor of about 8.4 percent.
BIOMASS
A substantial amount of electricity generation originated from biomass. According to the ISE Institute, the total generation capacity of all biomass power plants installed end of 2024 amounted to about 9,100 MW. The biomass energy production (net) in 2024 was 36.800 Billion kilowatt-hours, resulting in an average capacity factor of about 46.0 percent.
IMPORT AND EXPORT OF ELECTRICAL ENERGY
Trade in electrical energy also takes place across national borders in Europe. For example, in 2024, Germany imported 12.9 TWh from France (presumably mainly nuclear energy) and 12.0 TWh from Denmark (surplus wind energy). About 7.1 TWh were imported from Switzerland and 5.8 TWh from Norway. Low supply prices were the main reason for all these imports.
On the other hand, a total of 10.9 TWh werde exported to Austria and Luxembourg in 2024, which was likely used by pumped-storage power plants there. However, the physical electricity flows do not provide information about how much of the imported energy was actually used in Germany, but rather was passed on to neighboring countries in transit. Overall, Germany had an import surplus of 24.9 TWh in 2024.
WIND AND SOLAR POWER PEAK FIGURES
The German Fraunhofer Institute ISE
https://www.ise.fraunhofer.de/en
does publish electricity production data in Germany on a daily basis under
https://www.energy-charts.de/index.htm
Select "Language" then "Power" and "Electricity Production" and various interactive graphs are available. From the charts published, the following information can be extracted:
The highest wind power generation ever was recorded on December 21, 2023, at 11:00 hours, when 52,449 MW were generated.
The highest solar power generation ever occured on June 20, 2025, at 12:45 hours, when 52,837 MW were generated.
In 2024 the highest combined wind and solar power was recorded on August 23, at 12:30 hours, when 63,993 MW (wind onshore 25,243 MW, wind offshore 2,912 MW and solar 35,838 MW) were generated.
The very lowest combined wind and solar power was recorded November 06, 2024, at 17:30 hours, when a mere 117 MW were generated.
| Wind and solar | 117 MW |
| Biomass | 5,094 MW |
| Hydro | 2,679 MW |
| Fossil* | 35,814 MW |
| Nuclear | 0 MW |
| Miscellaneous | 1,329 MW |
| Total generation | 45,033 MW |
| Import | +13,570 MW |
| Pumped-storage | +4,710 MW |
| Subtotal | 63,313 MW |
| Actual Load | 66,512 MW |
* Sum of Brown Coal, Hard Coal, Gas and Oil. |
|
The above figures illustrate the full dilemma of the wind-solar problem, as at that time, the German grid had only 117 MW of combined wind and solar power available. The so-called "residual load", i.e. the capacity that must be covered after taking wind and solar power into account, was primarily replaced by fossil fuels, pumped-storage capacity, and imports.
According to Energy Charts, on November 6, 2024 at 17:30 hours, the residual load was 66,395 MW, while the actual load was 66,512 MW.
LOAD DATA
The load is defined as power consumption from the grid and the grid losses. But the pumped electricity consumption and the internal consumption of conventional power plants as well as the self-consumption of solar systems is not included.
In 2024 the highest load figure (sum of energy consumption plus grid losses) of 75,767 MW was recorded January 15, at 11:30 hours, whereas the lowest load of 32,300 MW occured September 22, at 03:30 hours.
RENEWABLE ENERGY SOURCES ACT EEG 2014
German law EEG 2014 specifies the preferred acceptance of renewable electric power into the grid, regardless of consumers demand. Producers of renewable power were guaranteed fixed energy payments per kilowatt-hour. The consumers, in turn, had to subsidize this by paying additionally a premium of 6.880 Eurocents per kilowatt-hour (2017 figure).
According to "Statista 2025", the preferred expansion of wind and solar in Germany has so far been subsidized with a total of over 220 Billion Euros. The EEG-levy was abolished in mid-2022, but the German federal budget for 2023 still had to step in with another 9.080 Billion Euros.
The European Energy Exchange (EEX) is a marketplace for the trading of electrical energy generated in Europe. Electrical energy is being traded either on the spot market or futures market. The volatility of wind and solar energy does result in certain variations of energy costs. Lack of regenerative energy (wind and solar) always is responsible for high short-term costs at the EEX. But in case the German grid is unable to absorb an extreme surplus of renewable generation, the prices per kilowatt-hour enter into negative territory. Neighboring countries then are prepared to accept electrical energy only by being paid a premium on top of the electrical energy delivered. On average, in 2024, one kilowatt-hour "day-ahead" was traded at the EEX at 7.80 Eurocents.
Bearing all the above in mind it is quite understandable that the average residential consumer in Germany is increasingly critical of the political wisdom of his government, as he is presently (2025) being charged between 30 and 40 Eurocents per kilowatt-hour.
Under these circumstances here another fact, not easy to understand: The highly efficient 1,600 MW hard coal power plant "Moorburg" near Hamburg became operational in 2015, with an additional 650 MW district heating capacity. Despite a construction cost of 3 Billion Euro, this plant was decommissioned for scrap in December 2020, instead of decommissioning low efficient and dirty brown coal power plants in other locations.
STATUS: August 31, 2025
11. TOTAL ELECTRICAL CAPACITY AND GENERATION IN 2024 IN GERMANY
According to the Federal Network Agency (BNetzA), by May 14, 2025, the in service electricity generation capacity - without pumped-storage - in Germany amounted to 242,219 MW net, whereas the German Fraunhofer Institute ISE for end of 2024 published the following figures:
| Hydro | 6,400 MW |
| Biomass | 9,100 MW |
| Brown coal | 15,200 MW |
| Hard coal | 16,000 MW |
| Oil | 4,400 MW |
| Gas | 36,700 MW |
| Wind onshore | 63,200 MW |
| Wind offshore | 9,200 MW |
| Solar | 97,600 MW |
| Miscellaneous | 3,200 MW |
| Total | 261,000 MW gross |
| Hydro | 22.500 Billion kilowatt-hours |
| Biomass | 36.800 Billion kilowatt-hours |
| Nuclear | 0 Billion kilowatt-hours |
| Brown coal | 71.100 Billion kilowatt-hours |
| Hard coal | 24.300 Billion kilowatt-hours |
| Gas | 48.400 Billion kilowatt-hours |
| Wind | 136.400 Billion kilowatt-hours |
| Solar | 59.800 Billion kilowatt-hours |
| Miscellaneous | 14.300 Billion kilowatt-hours |
| Import | 24.900 Billion kilowatt-hours |
| Total | 438.500 Billion kilowatt-hours |
The energy actually used in Germany in 2024 was only 413.600 Billion kilowatt-hours because 24.900 Billion kilowatt-hours were imported from other countries
The peak net electrical generation figure in 2024 occurred on February 05 at 12:45 hours, when a total of 84,502 MW was generated. The actual load figure (sum of energy consumption plus grid losses) was 68,388 MW
| Wind and solar | 63,730 MW |
| Biomass | 4,248 MW |
| Hydro | 2,391 MW |
| Fossil* | 12,782 MW |
| Nuclear | 0 MW |
| Miscellaneous | 1,351 MW |
| Total generation | 84,502 MW |
| Export | -15,751 MW |
| Pumped-storage | -3,760 MW |
| Subtotal | 64,991 MW |
| Actual Load | 68,388 MW |
* Sum of Brown Coal, Hard Coal, Gas and Oil. |
|
The minimum net electrical generation figure in 2024 occurred on May 26 at 05:45 hours, when a total of 32,783 MW was generated. The actual load figure (sum of energy consumption plus grid losses) was 33,208 MW
| Wind and solar | 2,385 MW |
| Biomass | 3,928 MW |
| Hydro | 2,979 MW |
| Fossil* | 9,809 MW |
| Nuclear | 0 MW |
| Miscellaneous | 1,097 MW |
| Total generation | 20,198 MW |
| Import | 13,096 MW |
| Pumped-storage | -511 MW |
| Subtotal | 32,783 MW |
| Actual Load | 33,208 MW |
* Sum of Brown Coal, Hard Coal, Gas and Oil. |
|
STATUS: August 31, 2025
12. PUMPED-STORAGE: THE ANSWER FOR ENERGY STORAGE?
Not really.
According to the "2025 World Hydropower Outlook" of IHA (International Hydropower Association), the total global pumped-storage capacity by the end of 2024 amounted to 189,412 MW. The leading countries according to IHA at this date were as follows:
| China | 58,690 MW |
| Japan | 27,470 MW |
| USA | 22,266 MW |
| Italy | 7,256 MW |
| Germany | 6,297 MW |
| Spain | 5,650 MW |
| Austria | 5,608 MW |
| France | 5,187 MW |
| India | 4,746 MW |
| South Korea | 4,700 MW |
As mentioned above, IHA determines the world’s total installed pumped-storage capacity at the end of 2024 to 189,412 MW. According to the "Energy Information Administration" (EIA) the global generation capacity (2023 figure) is about 9,080,000 MW. Pumped-storage therefore amounts to approximately 2.0 percent of this figure and to about 15.1 percent of the global hydro capacity of 1,253,870 MW.
One has to bear in mind, that solar energy is available only at daylight and that wind output figures in Germany occasionally drop to negligible figures. As already mentioned above, at 17:30 hours on November 06, 2024, for instance, nature generated a total of 117 MW. Under these conditions even a five times multiple installed wind and solar installation wouldn't have protected Germany from a total blackout, fortunately thermal plants and power imports from other countries were still able to step in this day.
The power swing of wind generation plus solar generation in Germany over one day can easily reach, and even exceed, 50,000 MW. Even if all neighboring countries of Germany are asked to step in, a power swing of this magnitude is beyond their combined pumped-storage capacity. In case of calm and cloudy weather situations in Germany, thermal power plants in Germany have to fill this gap. Fast reacting gas power plants can step in, if the required output is available. Otherwise fossil power plants must be activated, but their boilers have to be held constantly at uneconomic stand-by temperature. As a last resort, nuclear and thermal power plants in France or other countries have to fill the shortfall.
Some experts suggest to connect the Central European grid with Scandinavia. The storage capacity of Norwegian hydro power plants has been determined to be about 84 Billion kilowatt-hours and the Swedish figure is 34 Billion kilowatt-hours. On closer examination reality has out-dated experts advice: In April 2021 the 1,400 MW NordLink HVDC submarine cable - costing a total of 2 Billion Euro - commenced operation between Norway and Germany. This project went through realization despite the fact that Norway has too little pumped-storage capacity to absorb a substantial amount of excess wind energy from Northern Germany. Also, because electric car sales are hitting record levels in Norway, electricity consumption is rising to such an extent, that there is little energy available for export.
STATUS: August 31, 2025
13. BATTERY-STORAGE INSTEAD OF PUMPED-STORAGE?
In Germany, there is a debate about whether it is sensible and economical to store electrical energy in batteries. The energy company RWE is currently building two battery systems in North Rhine-Westphalia (in Hamm and Neurath) with the following data:
- 690 battery blocks
- 21,000 square meters of usable space
- 220 MW total peak power
- 235 MWh total energy storage capacity
- 140 Million Euros investment volume
Based on the above data, the following values result:
Replacing Germany's current 38,100 MWh pumped-storage power plants with battery-storage would currently cost 22.8 Billion Euros. As already mentioned in this forum, the total capacity of Germany's pumped-storage power plants is 6,297 MW. With Germany's storage capacity of 38,100 MWh, this would only be available to the German grid for six hours, regardless whether pumped-storage or battery-storage is taken into account.
The German term "Dunkelflaute" (dark period or dark spell) refers to times of extremely low electricity generation from wind and solar power. An example for Germany is the 48-hour period from December 11 to 13, 2024. During this time, wind power was continuously available at only 1,000 to 3,000 MW, while during the day, only 3,000 MW of solar power was available for very short periods. The absolute minimum from wind and solar power was 936 MW at 8:15 a.m. on December 12, 2024. During the three-day period, 70,000 MW of electricity was drawn from the grid for hours during the day. Fossil power plants and imports therefore had to step in with an average of 50,000 MW (fossil power plants 35,000 MW, imports 15,000 MW).
It is obvious that the two RWE battery-storage units, with a capacity of 235 MWh, can only be used locally. During a 48-hour dark period, only 4.9 MW of continuous power would be available across Germany.
As mentioned before, in Germany, some prominent lobbyists are even calling for multiple investments in existing wind and solar power plants, which would significantly exacerbate the dark period problem.
Experience with environmental organizations shows that it will be difficult for energy utilities to find a sensible solution to the problem of dark periods. It is obvious that neither pumped-storage nor battery-storage are suitable for surviving days-long power shortages in the grid. Only fossil-fuel power plants and imports can bridge days-long dark periods. Ultimately, Germany's only option is to expand gas-fired power plants and import rapidly available electricity.
Geographically, there is little space left in Germany for the construction of new pumped-storage power plants. Therefore, there are considerations to introduce a so-called "vehicle-to-grid" system instead. At the beginning of 2025, around 1.65 million purely electric vehicles were registerd in Germany. With fully charged 60 kWh batteries, a maximum of nearly 100,000 MWh of electrical energy would theoretically be available. In practice, however, only a fraction of this amount would be usable, as many vehicles are in use and others need to be charged.
In order to stabilize the grid, the vehicle-to-grid process must always ensure that either the vehicle batteries are not completely discharged or that the vehicle fleet is not connected to the grid for charging at the same time.
A widespread introduction of "smart electricity meters" could save consumers costs and better distribute grid load. Unfortunately, only about three percent of these meters are currently in operation in Germany. The vehicle-to-grid system therefore remains a dream until the German energy grid has the necessary infrastructure for smart electricity meters.
STATUS: August 31, 2025
Attention:
The short scale large-number naming system has been used throughout the „Reader’s Forum“. The relationship between the name and the corresponding numeric value is as follows:
1 Billion = 1 x 10⁹